Insights
The Insights view shows the results of a completed project run. What it displays depends on the type of tests that were generated:
- UI Tests — shows discovered workflows, execution steps, agent reasoning, and generated artifacts.
- Unit Tests — shows test generation metrics: compile status, runtime results, and a file/method tree.
Access it by selecting a project run from the project list.
Workflows List
The left panel lists all workflows discovered in the run, with a summary bar at the top showing Total, Passed, and Pending counts.
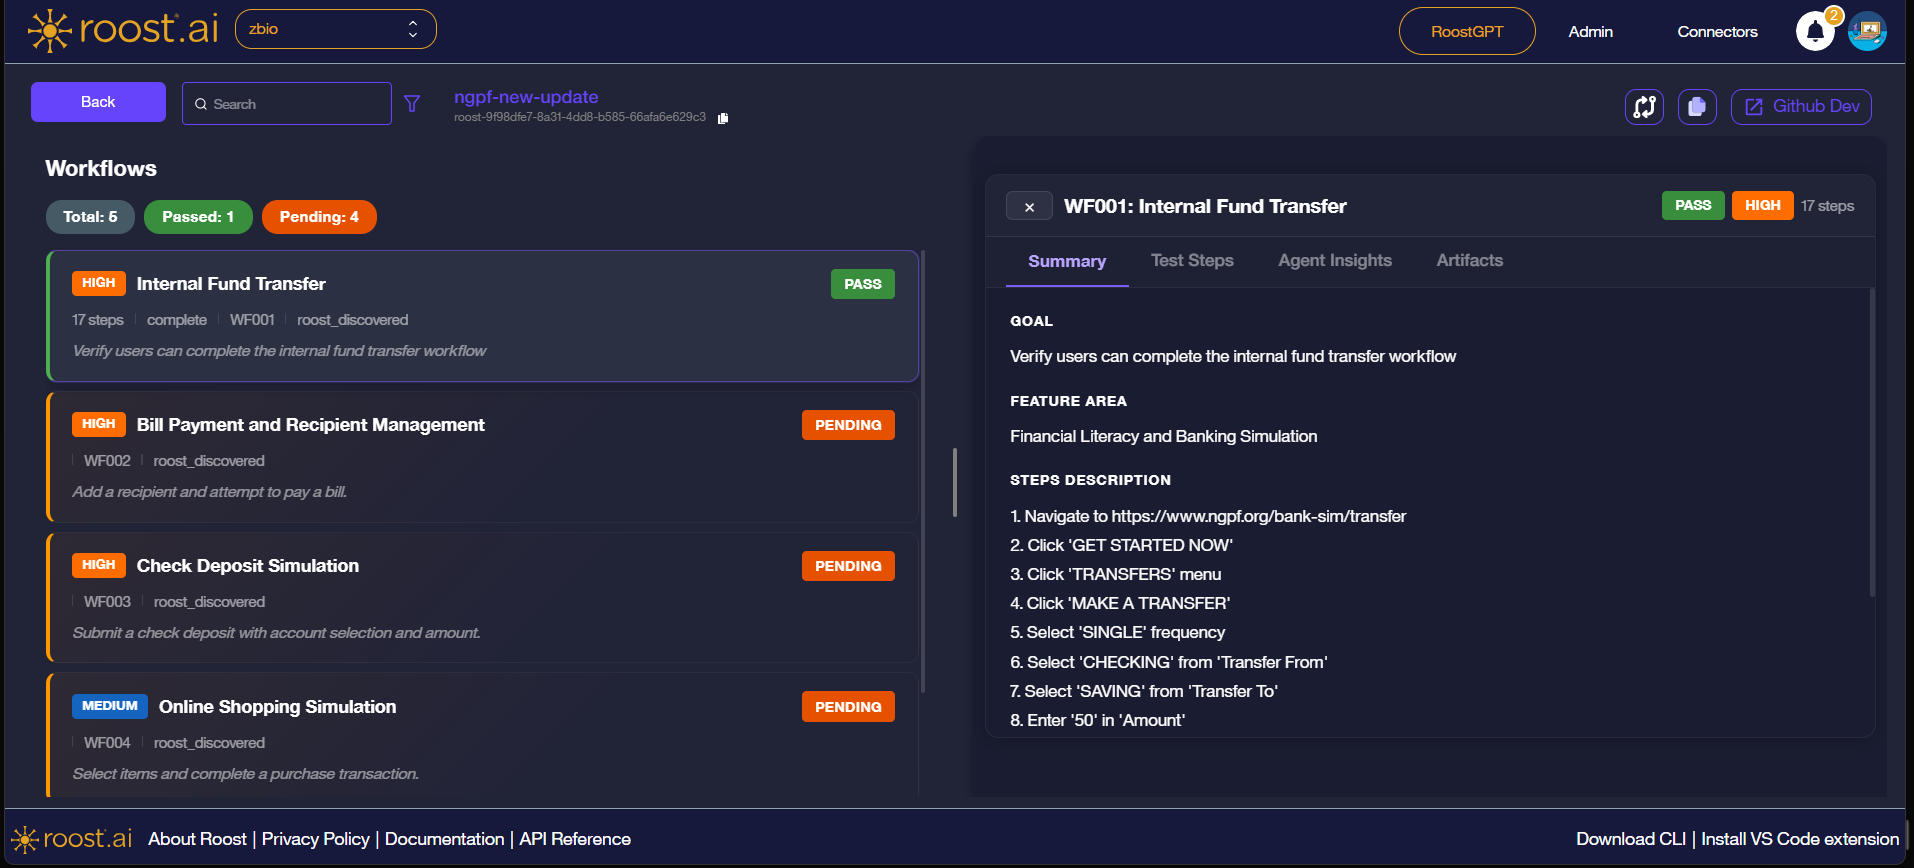
Each workflow card displays:
| Field | Description |
|---|---|
| Priority badge | HIGH or MEDIUM — indicates the business criticality of the workflow |
| Workflow name | Human-readable name discovered or assigned by the agent |
| Status badge | PASS (green) or PENDING (orange) — outcome of the most recent run |
| Step count | Number of steps executed in the workflow |
| Workflow ID | Unique identifier (e.g. WF001) |
| Discovery method | How the workflow was found (e.g. roost_discovered) |
| Goal | Short description of what the workflow validates |
Click any workflow card to open the detail panel on the right.
Workflow Detail Panel
The detail panel has four tabs: Summary, Test Steps, Agent Insights, and Artifacts.
Summary
The Summary tab gives a high-level description of the workflow.
| Field | Description |
|---|---|
| Goal | The objective the agent was asked to verify |
| Feature Area | The product or application area the workflow belongs to |
| Steps Description | A plain-language walkthrough of the steps the agent took |
Test Steps
The Test Steps tab shows the exact actions the agent performed, in order.
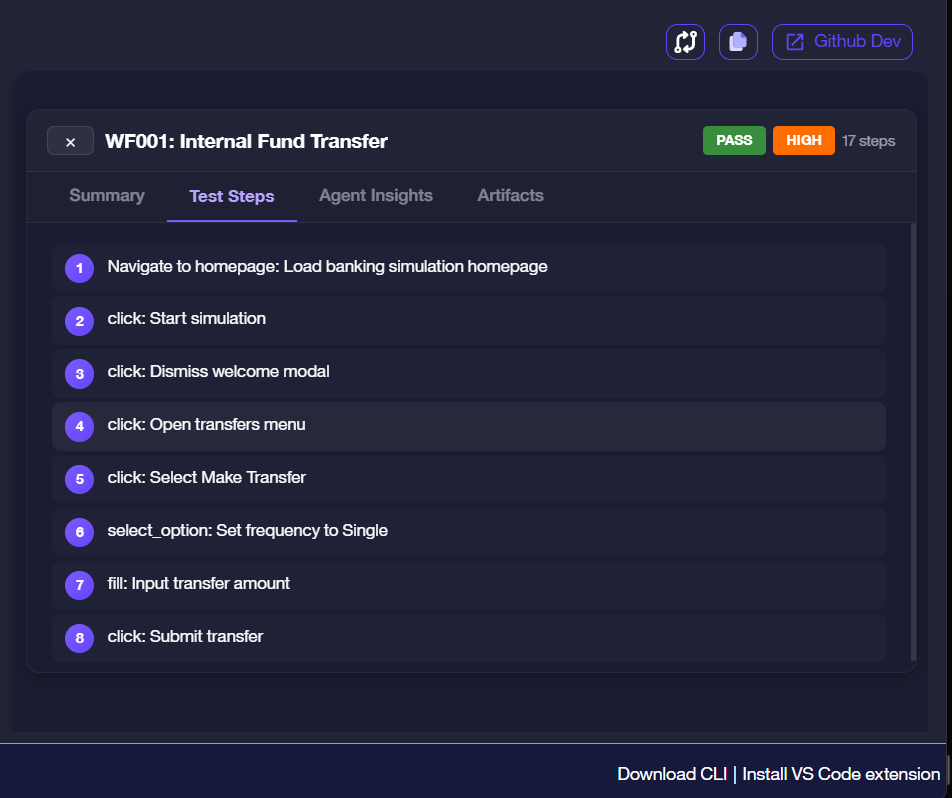
Each step entry shows the action type followed by a brief description:
| Action Type | Meaning |
|---|---|
navigate_to | The agent loaded a URL |
click | The agent clicked a UI element |
select_option | The agent selected a value from a dropdown |
fill | The agent typed text into an input field |
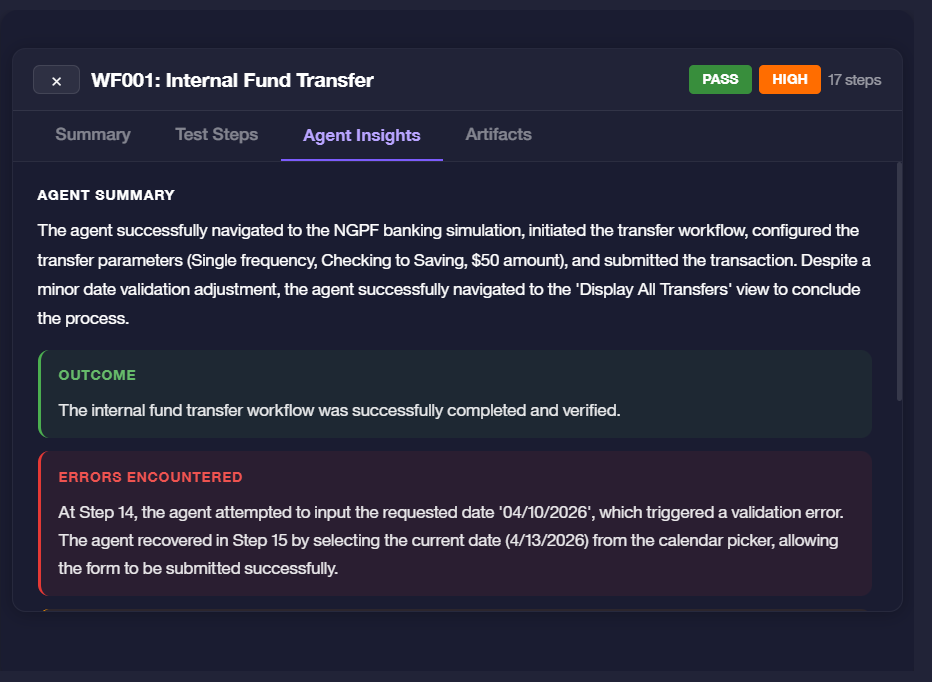
Agent Insights
The Agent Insights tab shows the agent's own assessment of the run — what it intended to do, what it observed, and how it handled any issues.
| Section | Description |
|---|---|
| Agent Summary | A narrative of the agent's actions and decisions during the run |
| Outcome | Green box — the final result if the workflow completed successfully |
| Errors Encountered | Red box — any failures or unexpected conditions the agent hit, including how it recovered |
An error in the Errors Encountered section does not always mean the workflow failed. The agent may have self-corrected and still completed the workflow, as shown by a PASS status on the card.
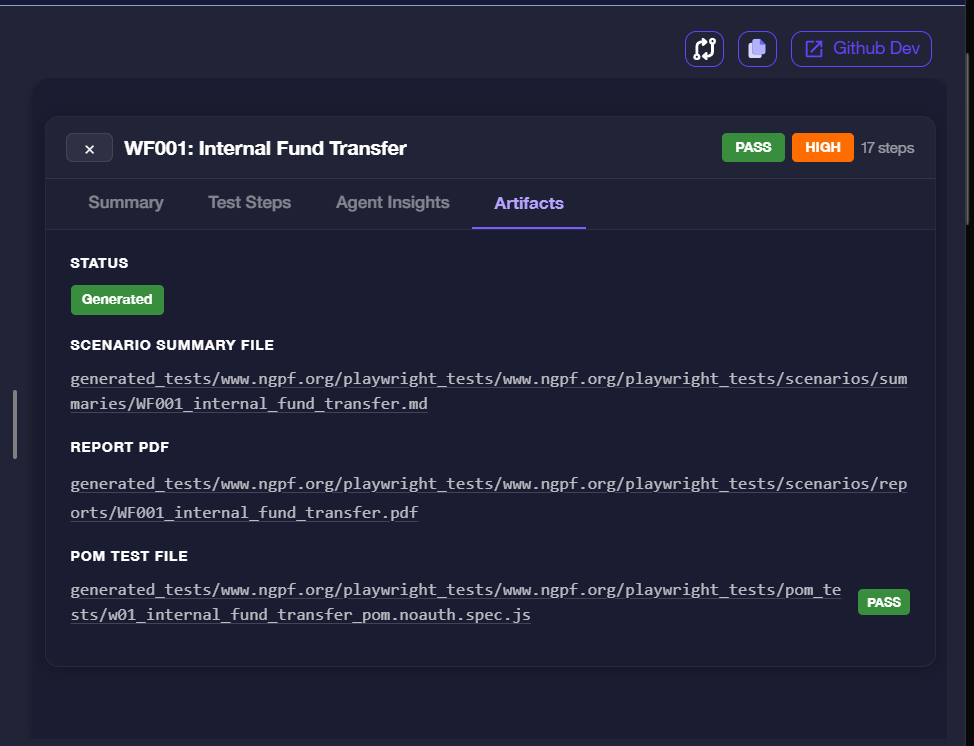
Artifacts
The Artifacts tab lists the files generated from the workflow run.
| Artifact | Description |
|---|---|
| Status | Generated (green) confirms that artifact files were successfully produced |
| Scenario Summary File | A .md file summarising the workflow scenario and outcomes |
| Report PDF | A step-by-step PDF capturing each action the agent will take, with screenshots, to achieve the workflow scenario. |
| POM Test File | A Playwright Page Object Model spec file ready to run in CI — the badge next to it reflects its own test result (PASS / FAIL) |
The file paths shown are relative to the generated test output directory for the project.
Unit Test Insights
When the project run is for unit tests, the Insights view shows a metrics dashboard instead of the workflow list. It summarises how many tests were generated, whether they compiled, and how they performed at runtime.
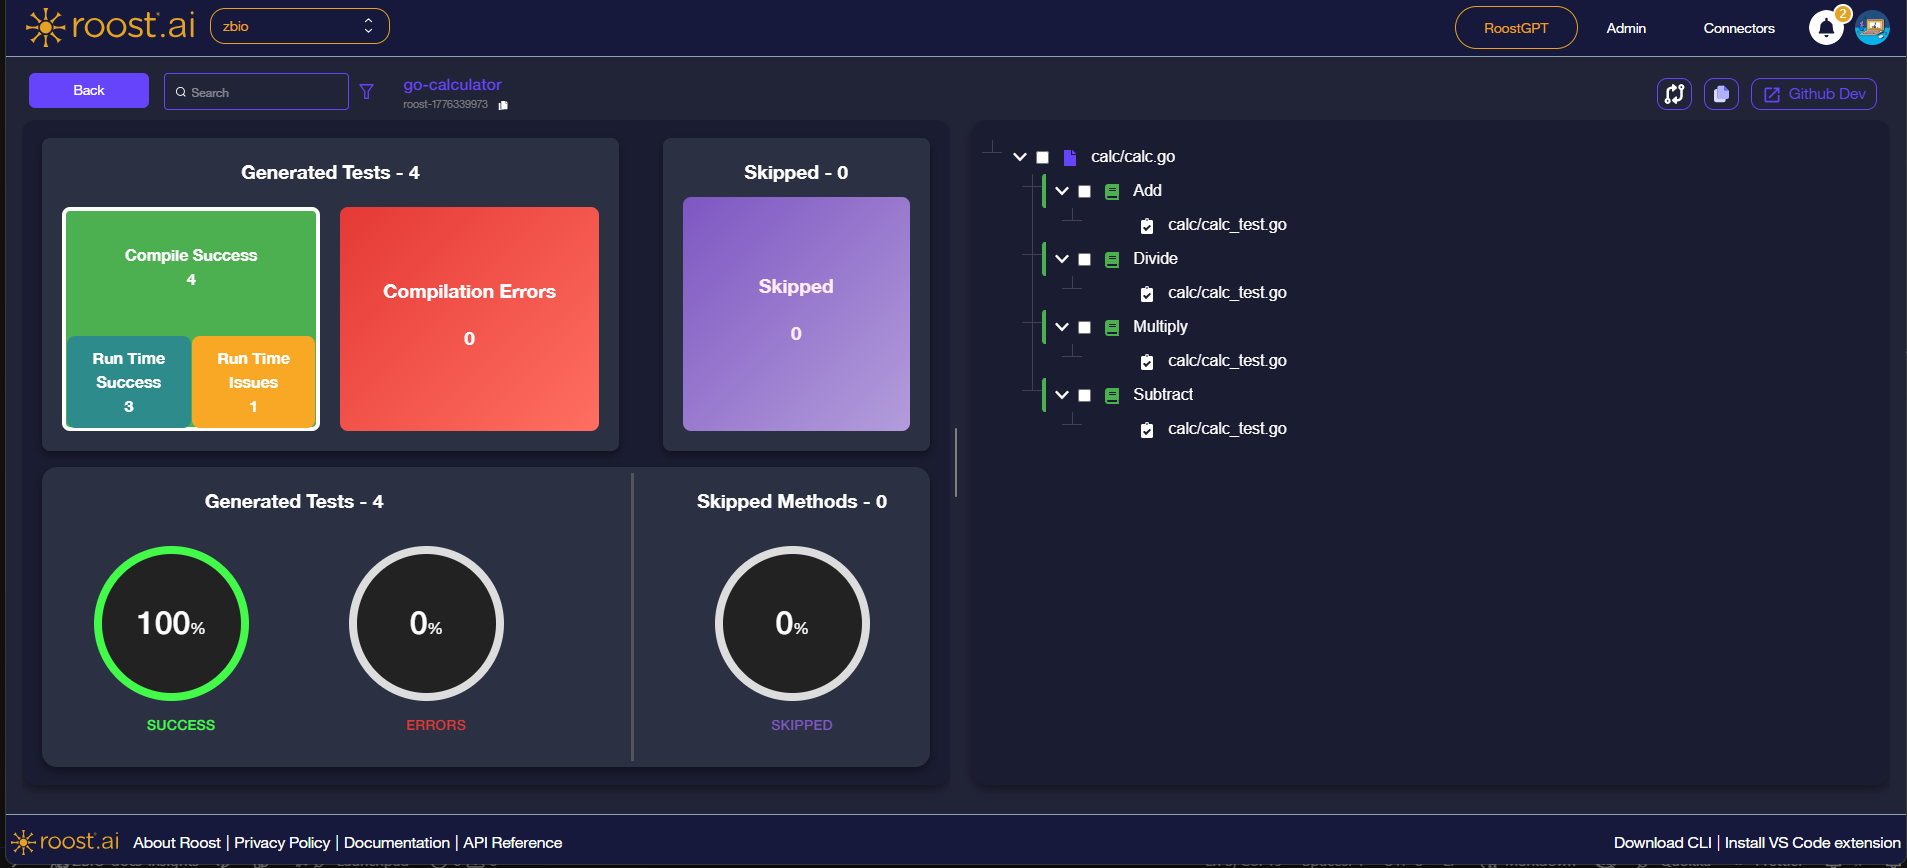
Metric Cards
The top row shows two summary tiles:
| Tile | Description |
|---|---|
| Generated Tests | Total number of test cases Roost generated for the project |
| Skipped | Number of methods that were skipped during generation |
The Generated Tests tile breaks down results further:
| Metric | Description |
|---|---|
| Compile Success | Tests that compiled without errors |
| Compilation Errors | Tests that failed to compile |
| Run Time Success | Tests that compiled and passed at runtime |
| Run Time Issues | Tests that compiled but encountered failures or errors at runtime |
Donut Charts
The bottom row shows three percentage rings for a quick visual summary:
| Chart | Description |
|---|---|
| SUCCESS | Percentage of generated tests that compiled and passed |
| ERRORS | Percentage of generated tests that had compilation or runtime errors |
| SKIPPED | Percentage of methods that were skipped |
File and Method Tree
The right panel shows a collapsible tree of source files, methods, and the generated test files:
- Source file (e.g.
calc/calc.go) — top-level node- Method (e.g.
Add,Divide) — each discovered method- Test file (e.g.
calc/calc_test.go) — the generated test file for that method
- Test file (e.g.
- Method (e.g.
Use the checkboxes in the tree to select specific files or methods. Use the Github Dev button in the top-right to open the generated tests directly in GitHub's web editor.