User Analysis
The User Analysis page provides a detailed breakdown of AI usage for an individual user within the selected project and date range. It can be reached by clicking View Details from the Leaderboard, or by navigating directly via the left sidebar.
This page covers the Super Admin user analysis experience. For the project-scoped admin view, see Admin AI Dashboard.
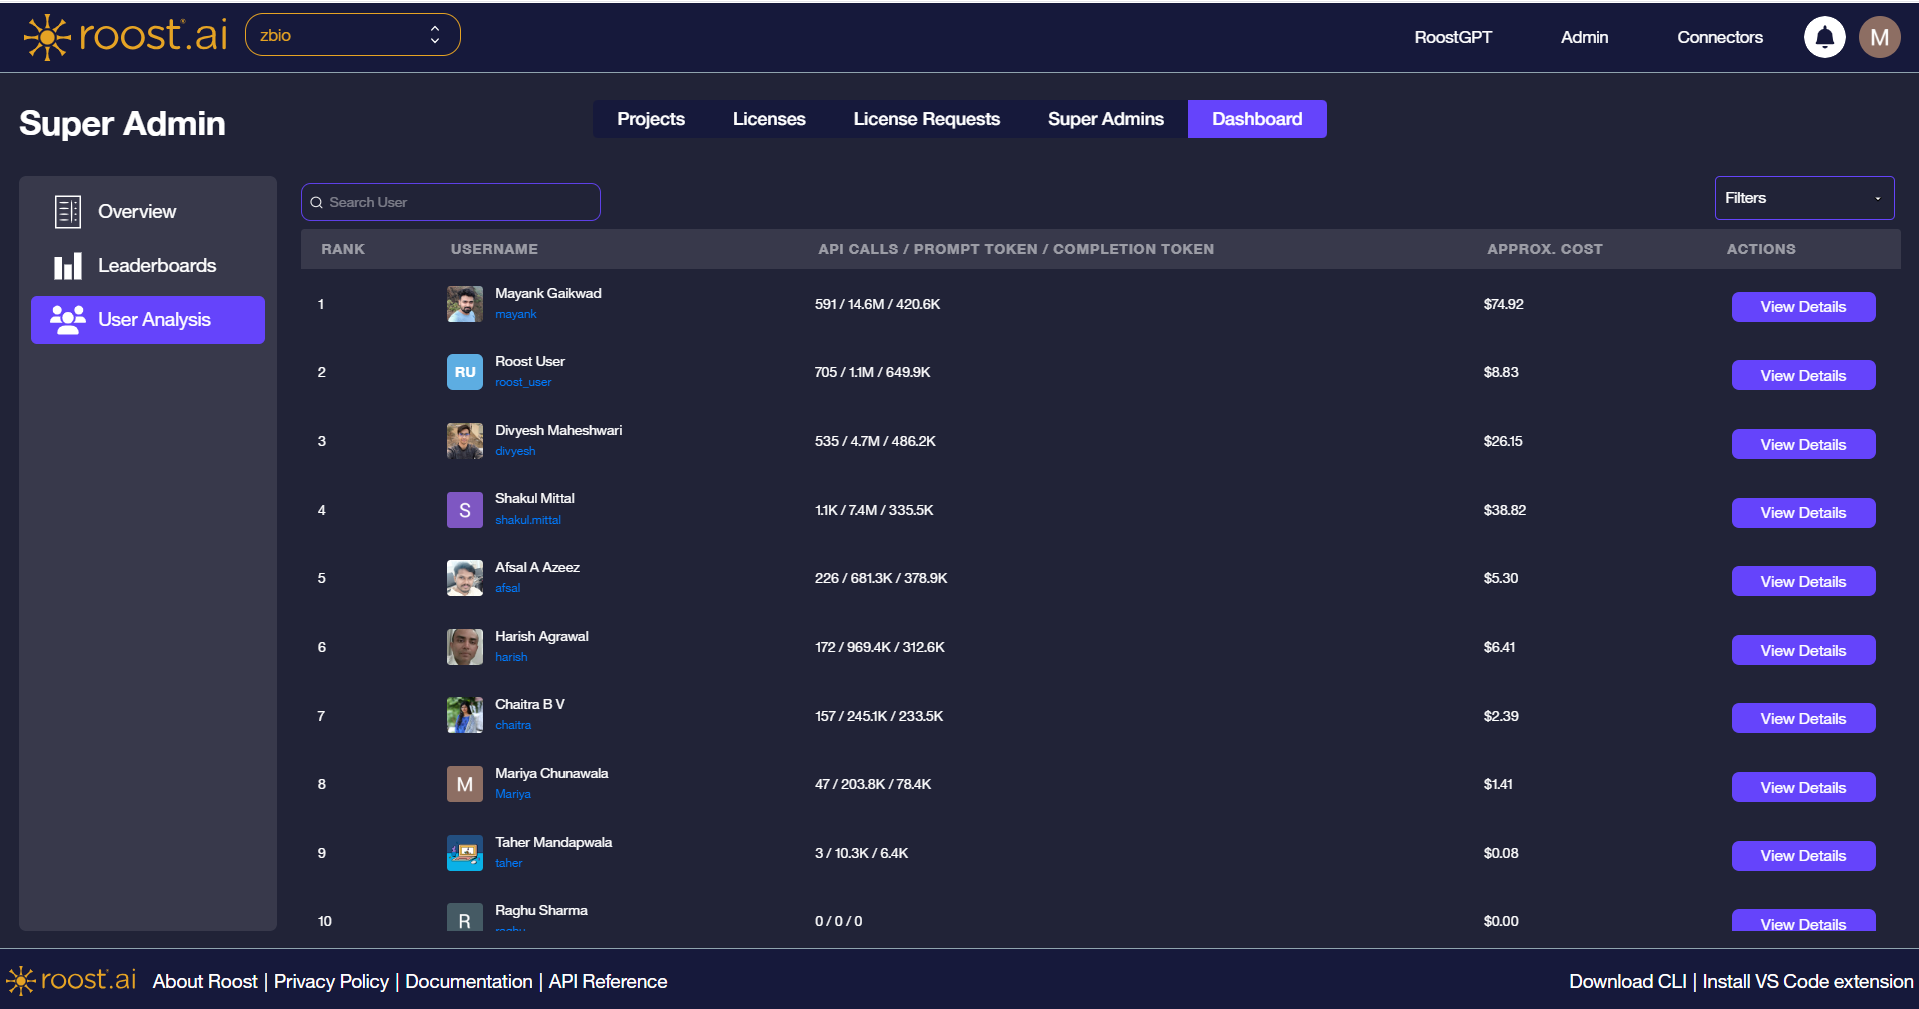
User List and Search
When opened directly from the sidebar, the page displays the full ranked user list — the same view as the Leaderboard. Use the Search User box to locate a specific user without returning to the Leaderboard.
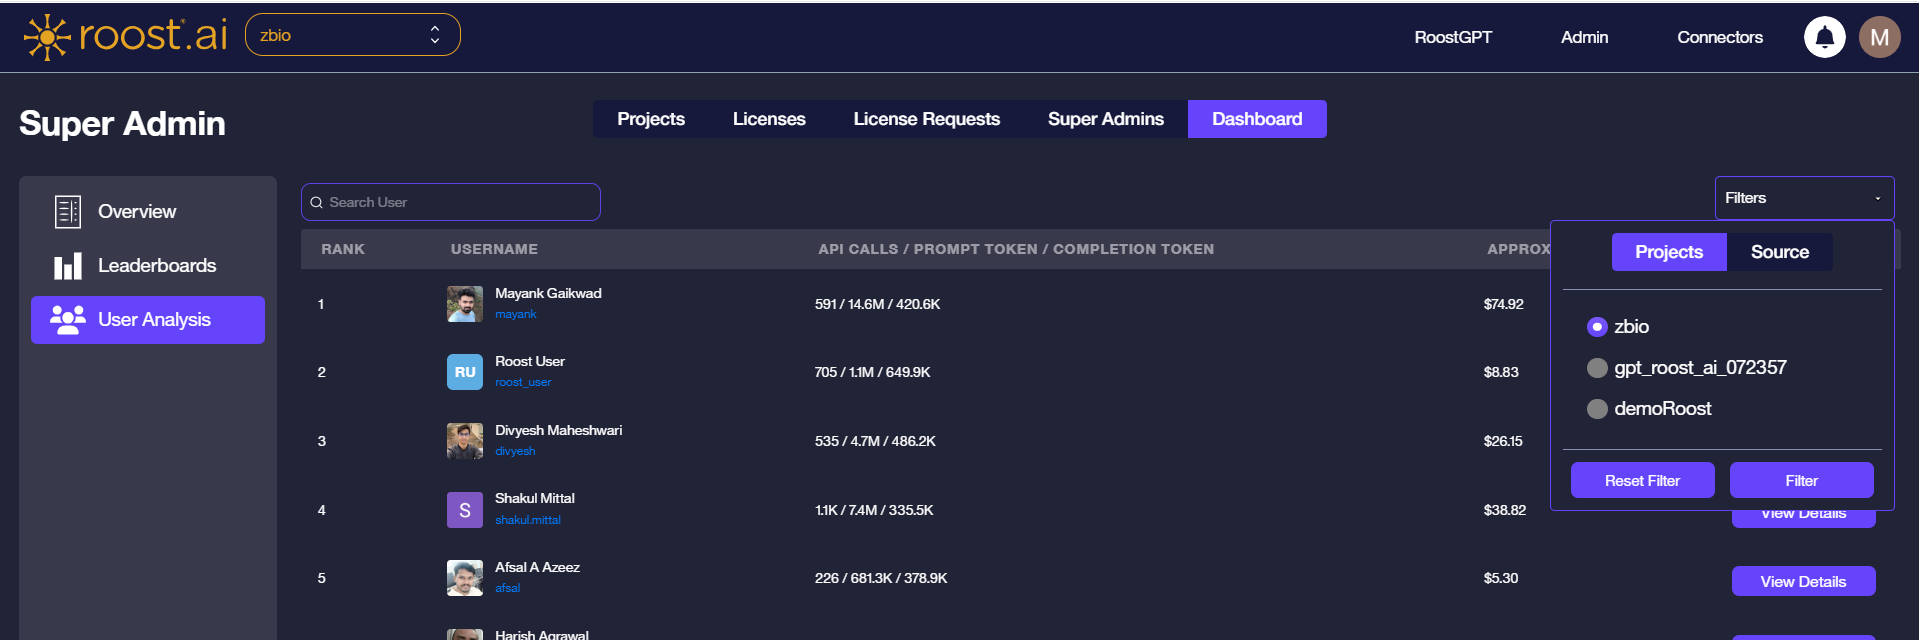
Filters
Click the Filters dropdown to scope the analysis by project or trigger source.
Projects
Select the active project to limit the analysis to usage within that project.
Source
Filter by trigger source: All, UI, CLI, or IDE.
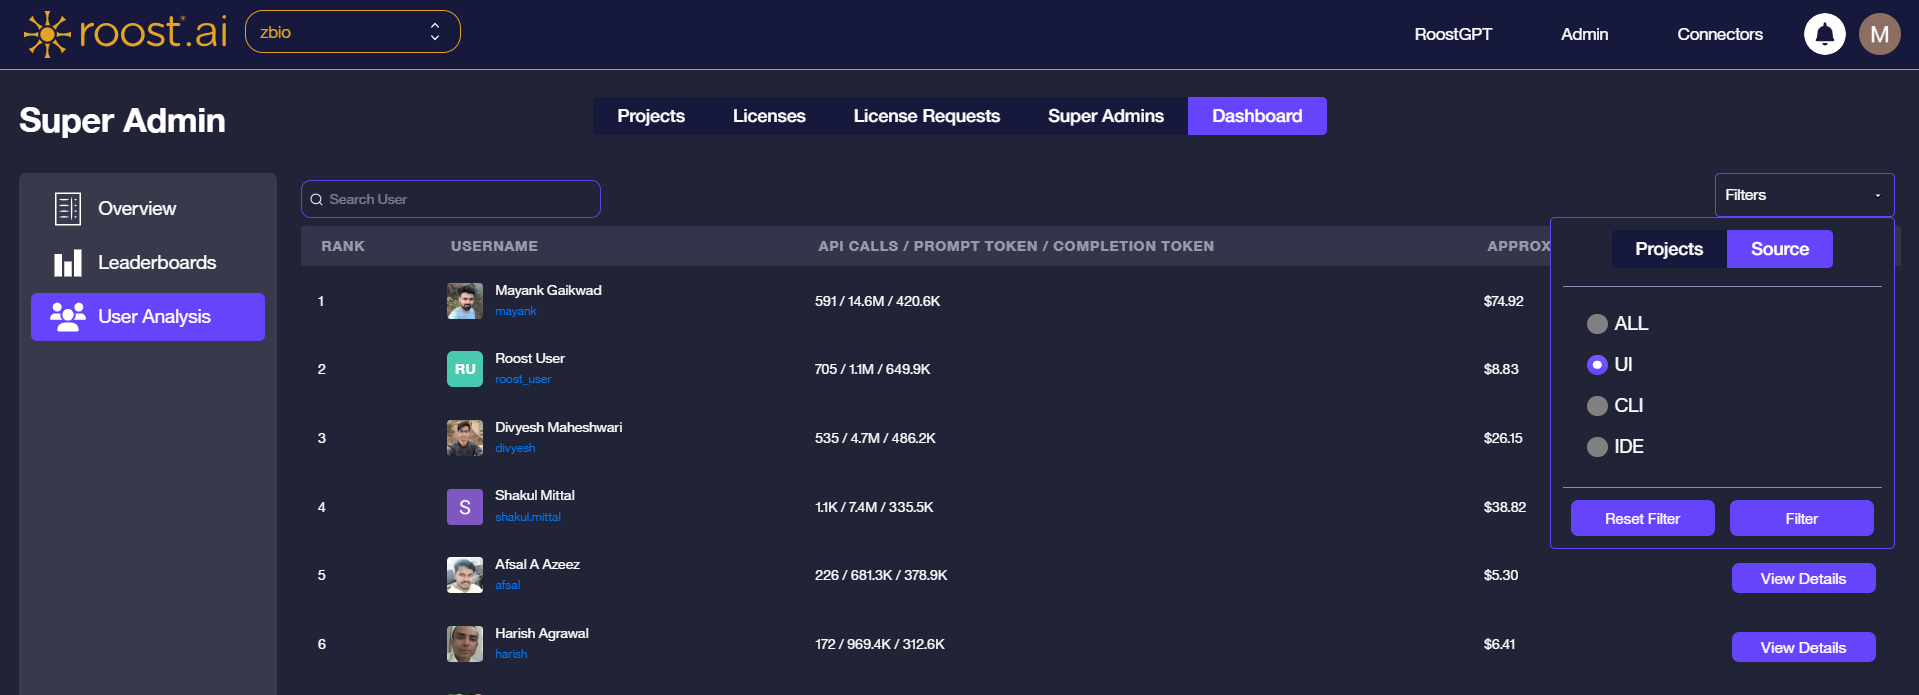
Filters apply immediately when confirmed. Click Reset Filter to restore defaults.
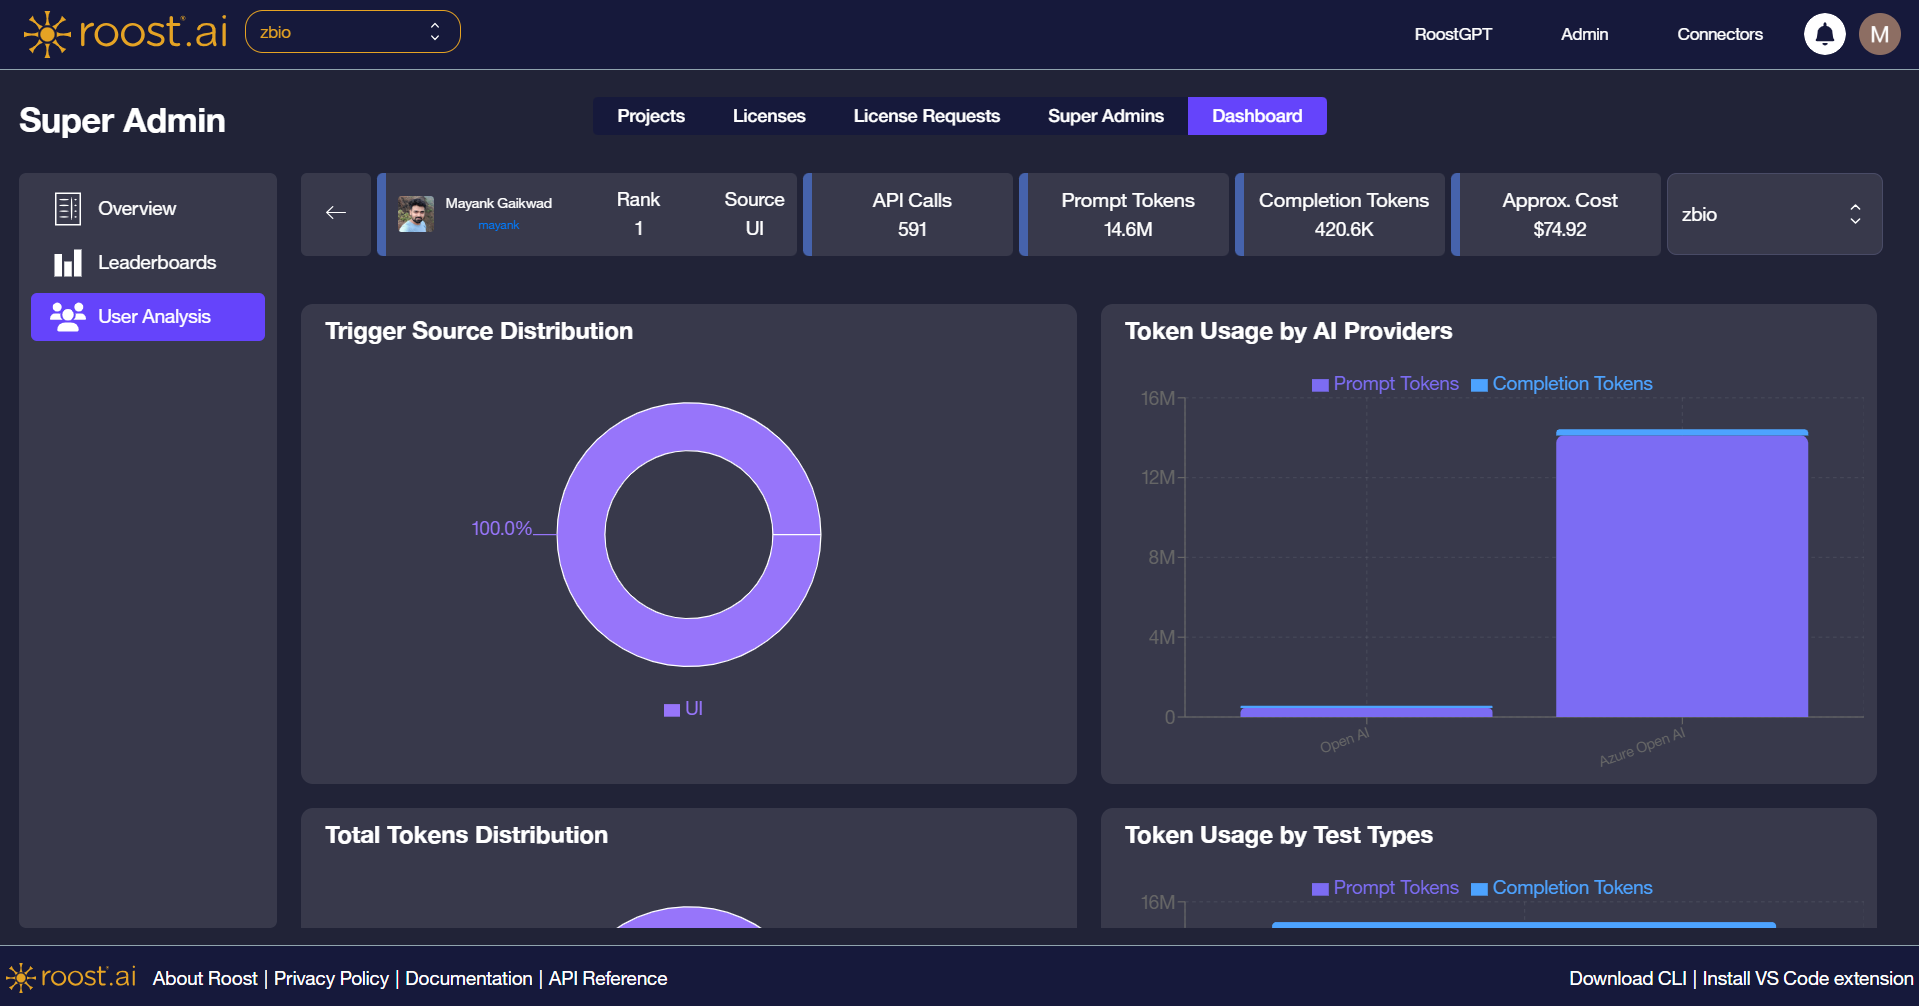
Individual User Detail
When a user is selected — either via View Details from the Leaderboard or by clicking a row in the user list — the page switches to the individual detail view.
A summary bar at the top displays the user's key metrics at a glance:
| Metric | Description |
|---|---|
| Rank | User's position in the leaderboard for the current scope |
| Source | Primary trigger source for this user's activity |
| API Calls | Total number of AI API calls made |
| Prompt Tokens | Total prompt tokens consumed |
| Completion Tokens | Total completion tokens consumed |
| Approx. Cost | Estimated spend based on configured token rates |
Below the summary bar, four charts break down activity across key dimensions:
- Trigger Source Distribution — donut chart showing the share of usage from UI, CLI, and IDE.
- Token Usage by AI Providers — grouped bar chart comparing prompt and completion tokens across AI providers used by this user.
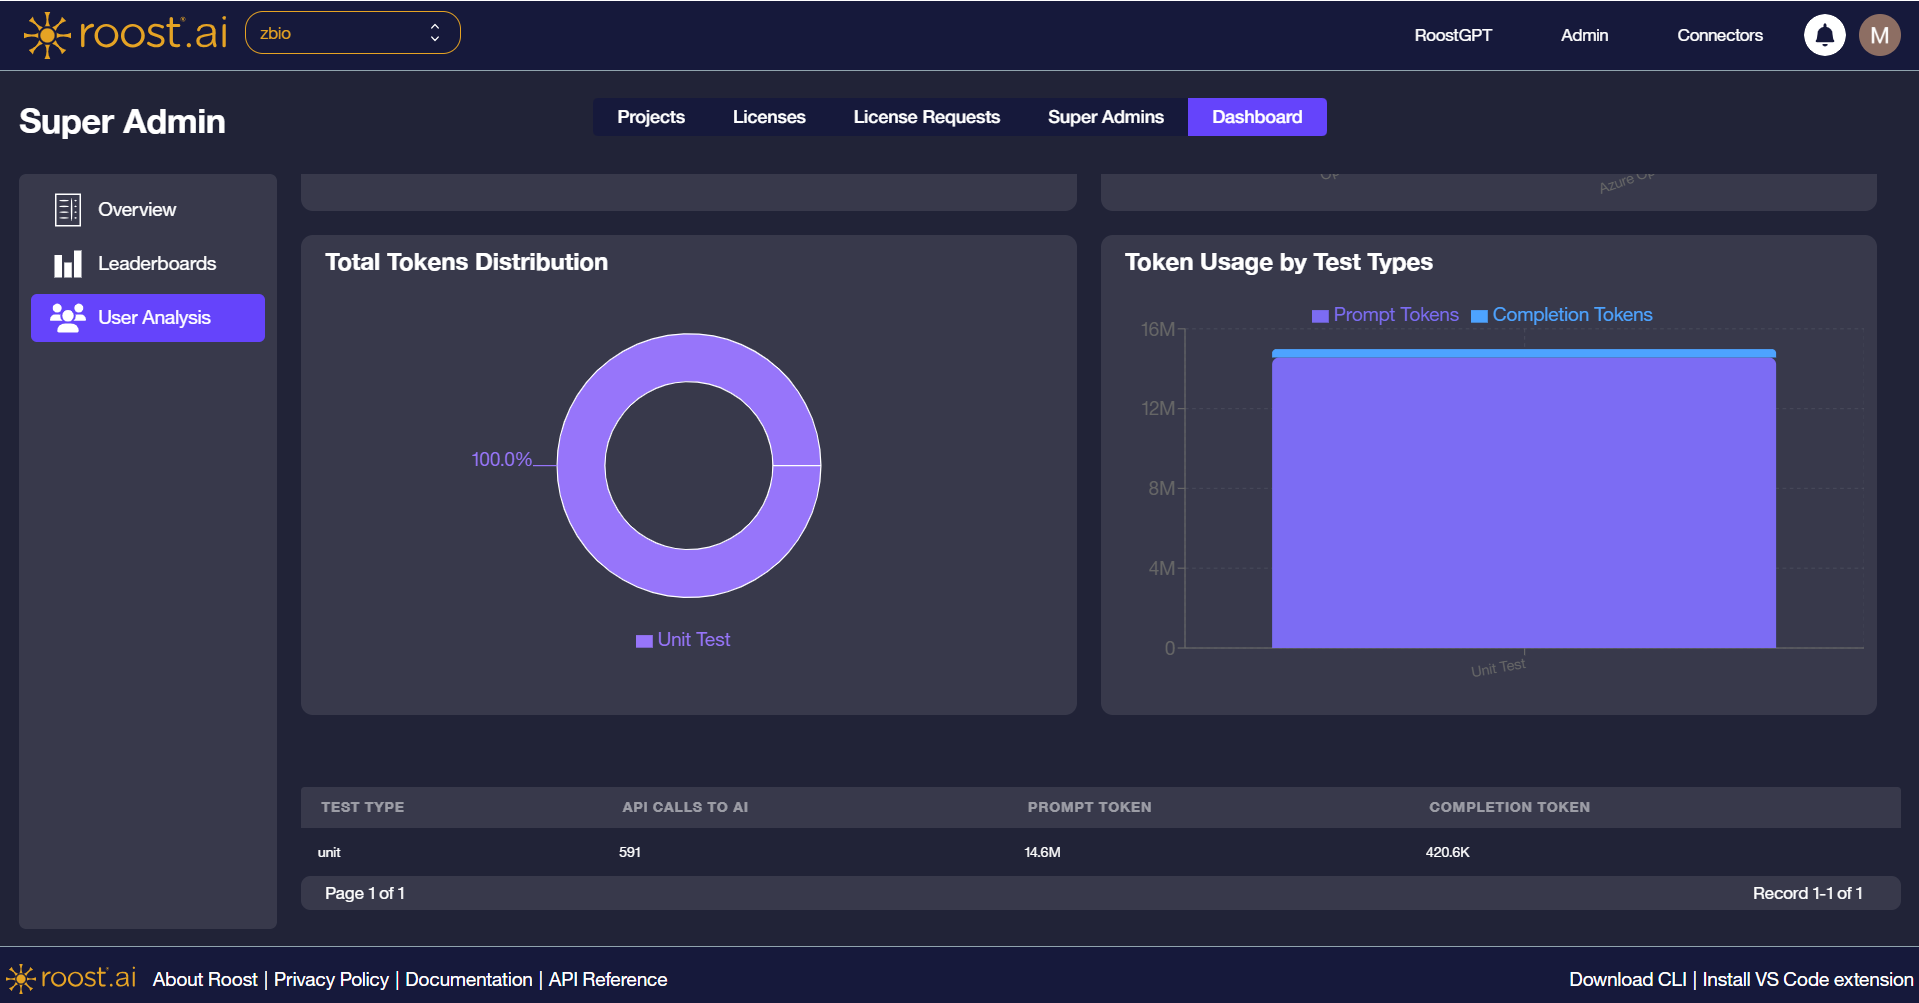
- Total Tokens Distribution — donut chart showing the proportion of prompt vs. completion tokens overall.
- Token Usage by Test Types — bar chart showing how AI activity is distributed across test categories.
A detail table at the bottom lists per-test-type statistics including API calls, prompt tokens, and completion tokens.
All charts and the detail table update immediately when the project selector or filters change.