AI Dashboard Overview
The Overview page provides a workspace-level summary of AI token consumption and model activity for the selected project over the last 30 days. It is part of the Super Admin Dashboard, accessible via the Dashboard tab in the Super Admin panel.
This page covers the Super Admin dashboard experience. For the project-scoped admin view, see Admin AI Dashboard.
Navigation
The left sidebar provides access to the three dashboard views:
| Section | Description |
|---|---|
| Overview | Token distribution and usage summary for the selected project |
| Leaderboards | User activity rankings by API calls and token consumption |
| User Analysis | Detailed per-user breakdown of AI usage |
Use the Select Project dropdown at the top of the page to switch between projects. All charts and metrics update to reflect the selected project.
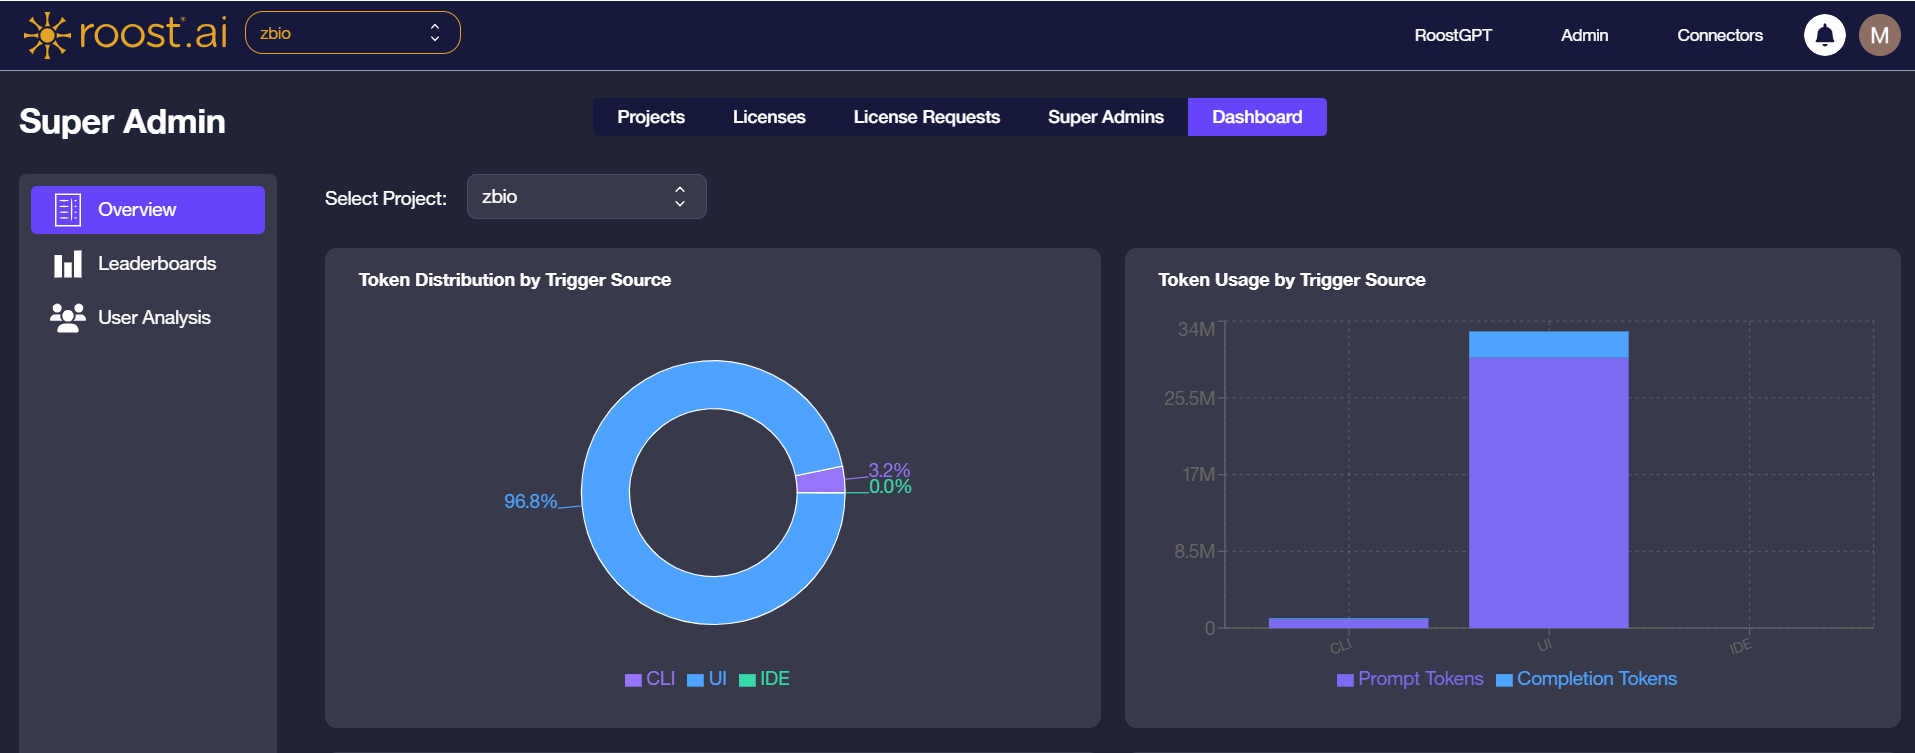
Token Distribution and Usage by Trigger Source
The first row of charts shows how token usage is distributed across the three trigger sources — CLI, UI, and IDE.
- Token Distribution by Trigger Source — a donut chart showing the relative share of total token usage from each source.
- Token Usage by Trigger Source — a grouped bar chart comparing prompt tokens and completion tokens per source, useful for identifying whether usage is input-heavy or output-heavy.
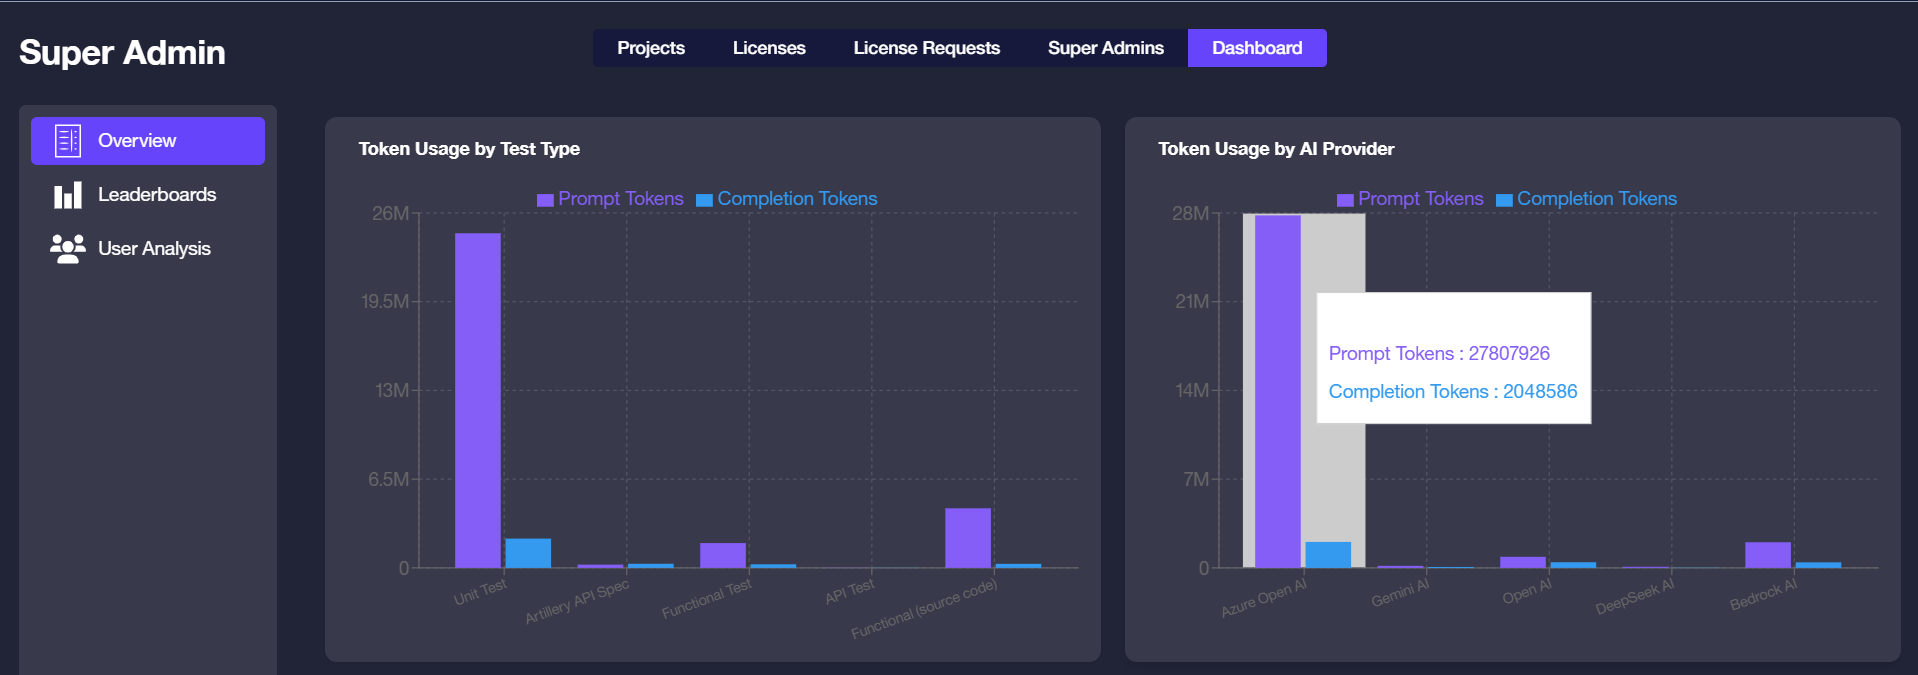
Token Usage by Test Type and AI Provider
The second row breaks down token consumption by what was generated and which AI backend was used.
- Token Usage by Test Type — compares prompt and completion tokens across test categories: Unit Test, API Test, UI Test, Integration Test, Functional Test, and Functional (source code).
- Token Usage by AI Provider — compares prompt and completion tokens across providers: Azure OpenAI, AWS Bedrock, Google Gemini, OpenAI, Claude AI, and DeepSeek AI. Use this to assess cost efficiency across providers.
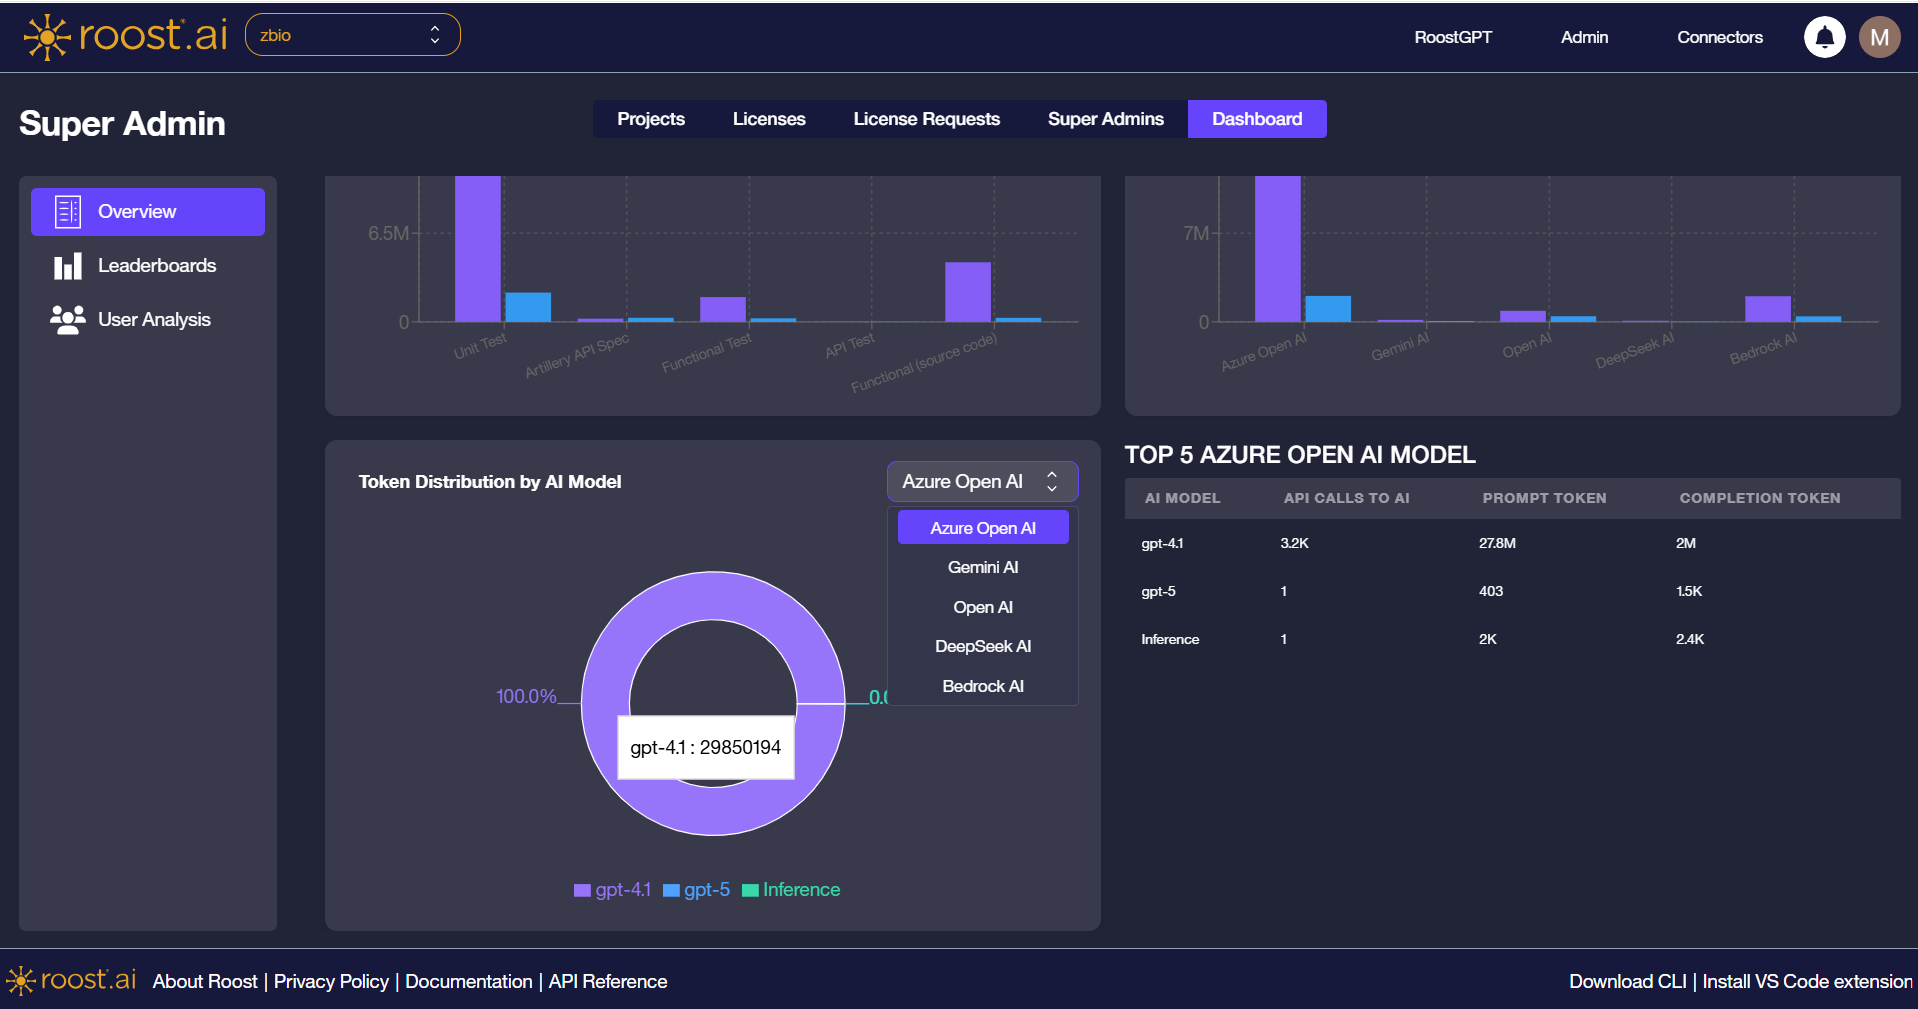
Token Distribution and Top Models by AI Provider
The third section focuses on model-level detail within a selected provider.
- Token Distribution by AI Model — a donut chart showing how token usage is distributed across models for the selected provider. Use the provider dropdown to switch between providers.
- Top 5 Provider Model table — ranks the five most active models for the selected provider by API call count, prompt tokens, and completion tokens.
Notes
- All data on this page is scoped to the last 30 days and the selected project.
- Selecting a different AI provider in the dropdown updates both the donut chart and the Top 5 model table.