Leaderboard
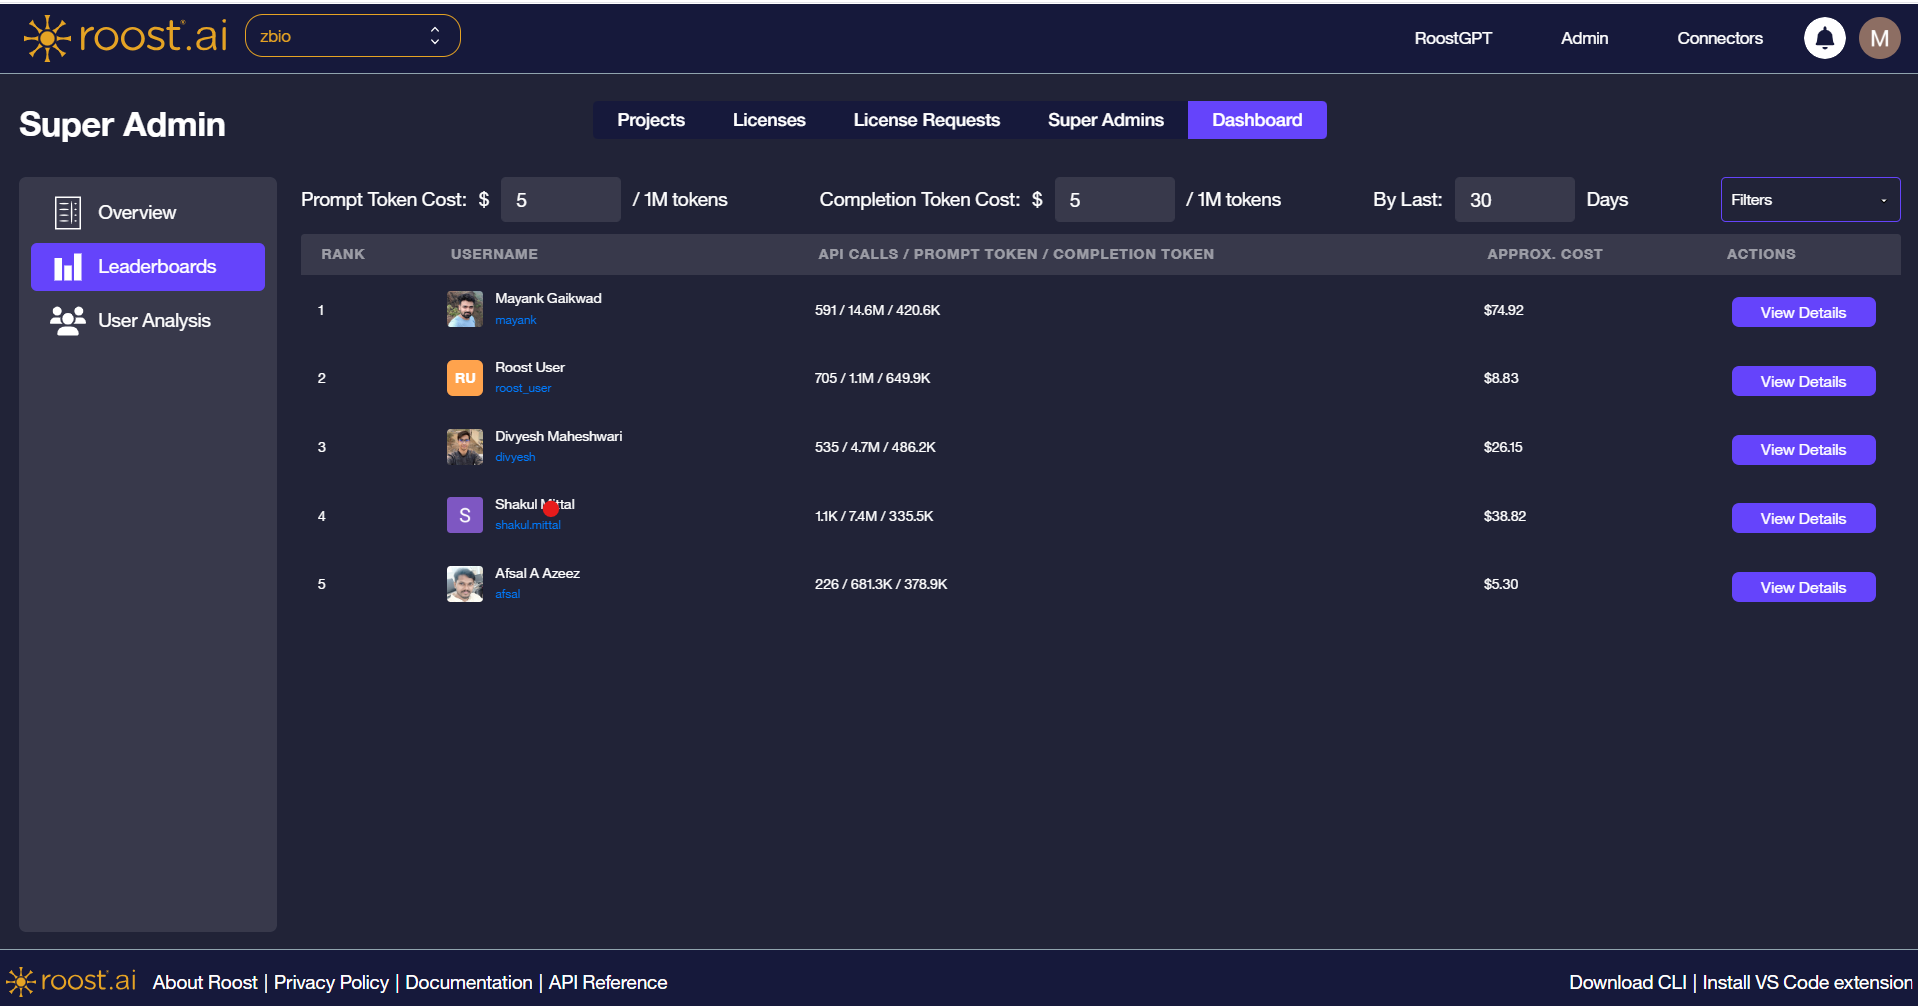
The Leaderboard page ranks users by AI activity for the selected project, showing API call volume, token consumption, and estimated cost over a configurable time window.
This page covers the Super Admin leaderboard experience. For the project-scoped admin view, see Admin AI Dashboard.
Leaderboard Table
The table ranks users in descending order of activity. The header row exposes two cost inputs used to calculate the approximate spend shown per user.
| Column | Description |
|---|---|
| Rank | User position based on overall activity |
| Username | Display name and username of the user |
| API Calls / Prompt Token / Completion Token | Combined usage summary showing call volume and token consumption |
| Approx. Cost | Estimated spend calculated from the configured prompt and completion token rates |
| Actions | View Details button to open that user in the User Analysis view |
Configure the cost inputs at the top of the page — Prompt Token Cost and Completion Token Cost (per 1M tokens) — to align cost estimates with your AI provider pricing.
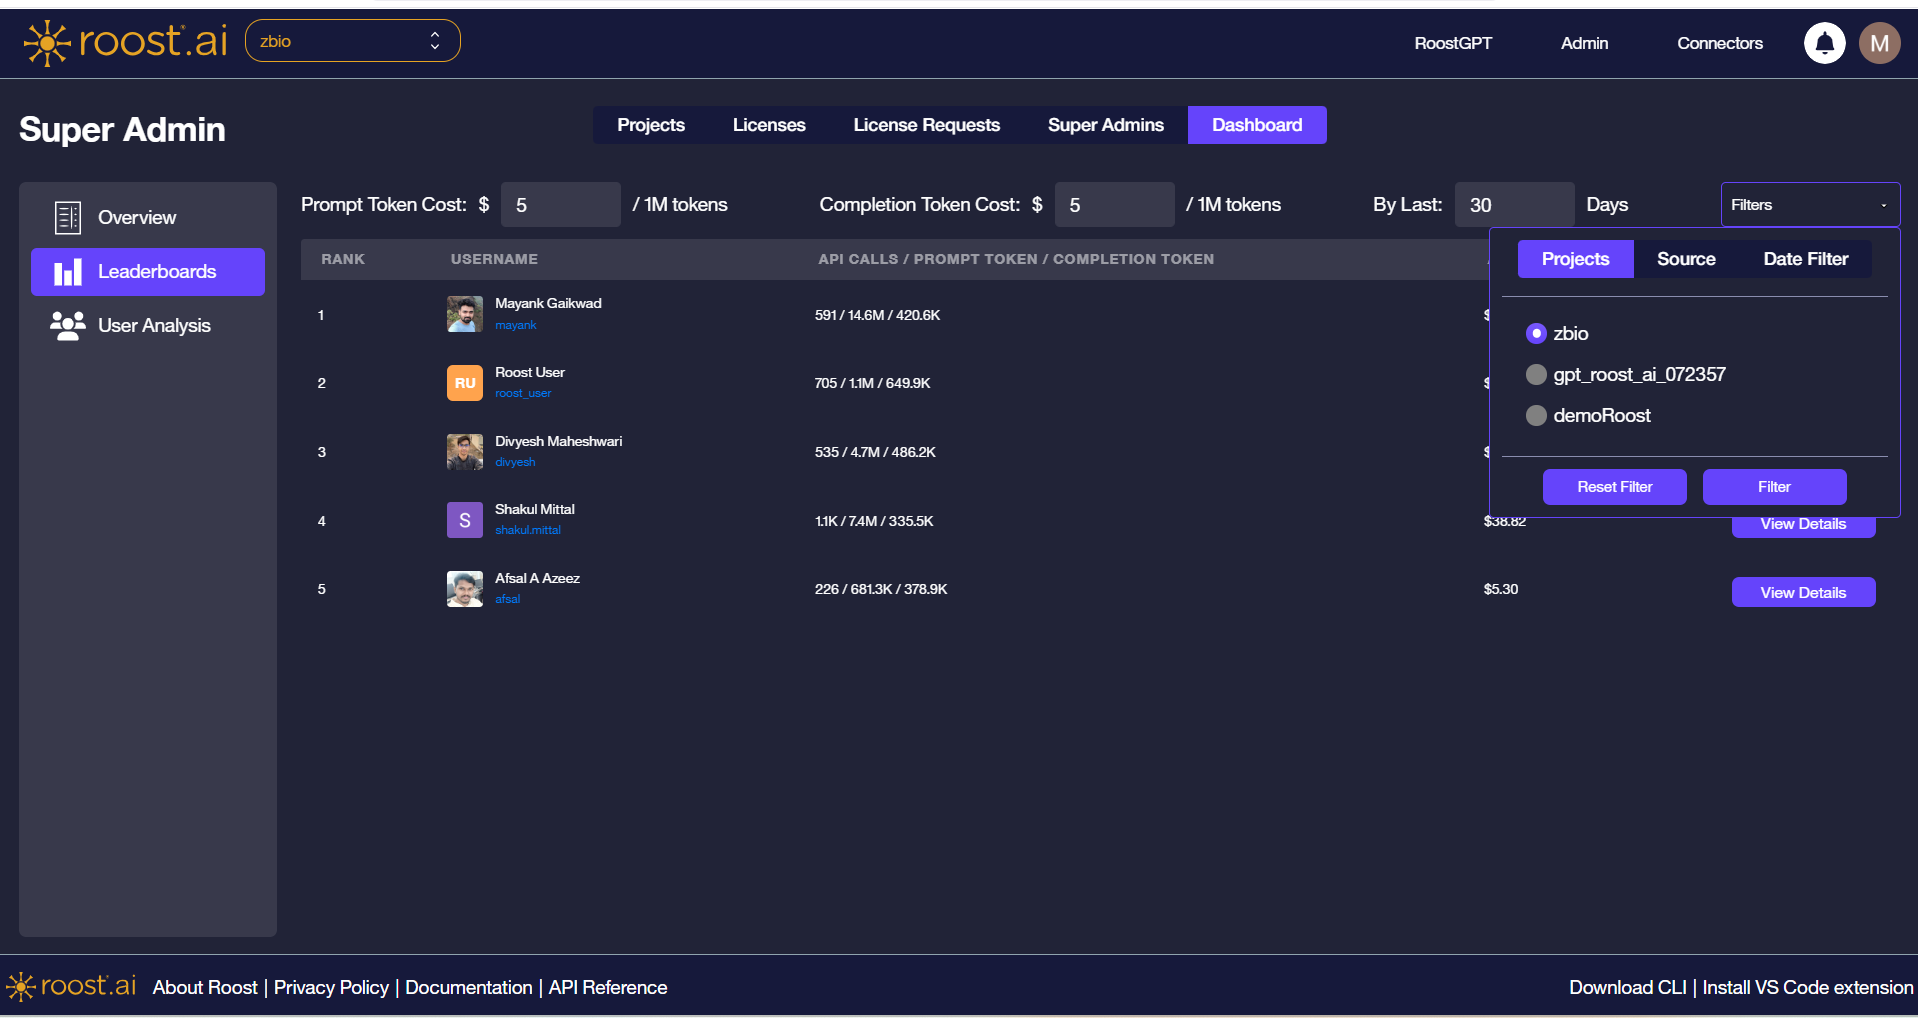
Filters
Click the Filters dropdown in the top-right corner to refine the leaderboard data. The filter panel has three tabs:
Projects
Select which project the leaderboard is scoped to. Only one project can be active at a time.
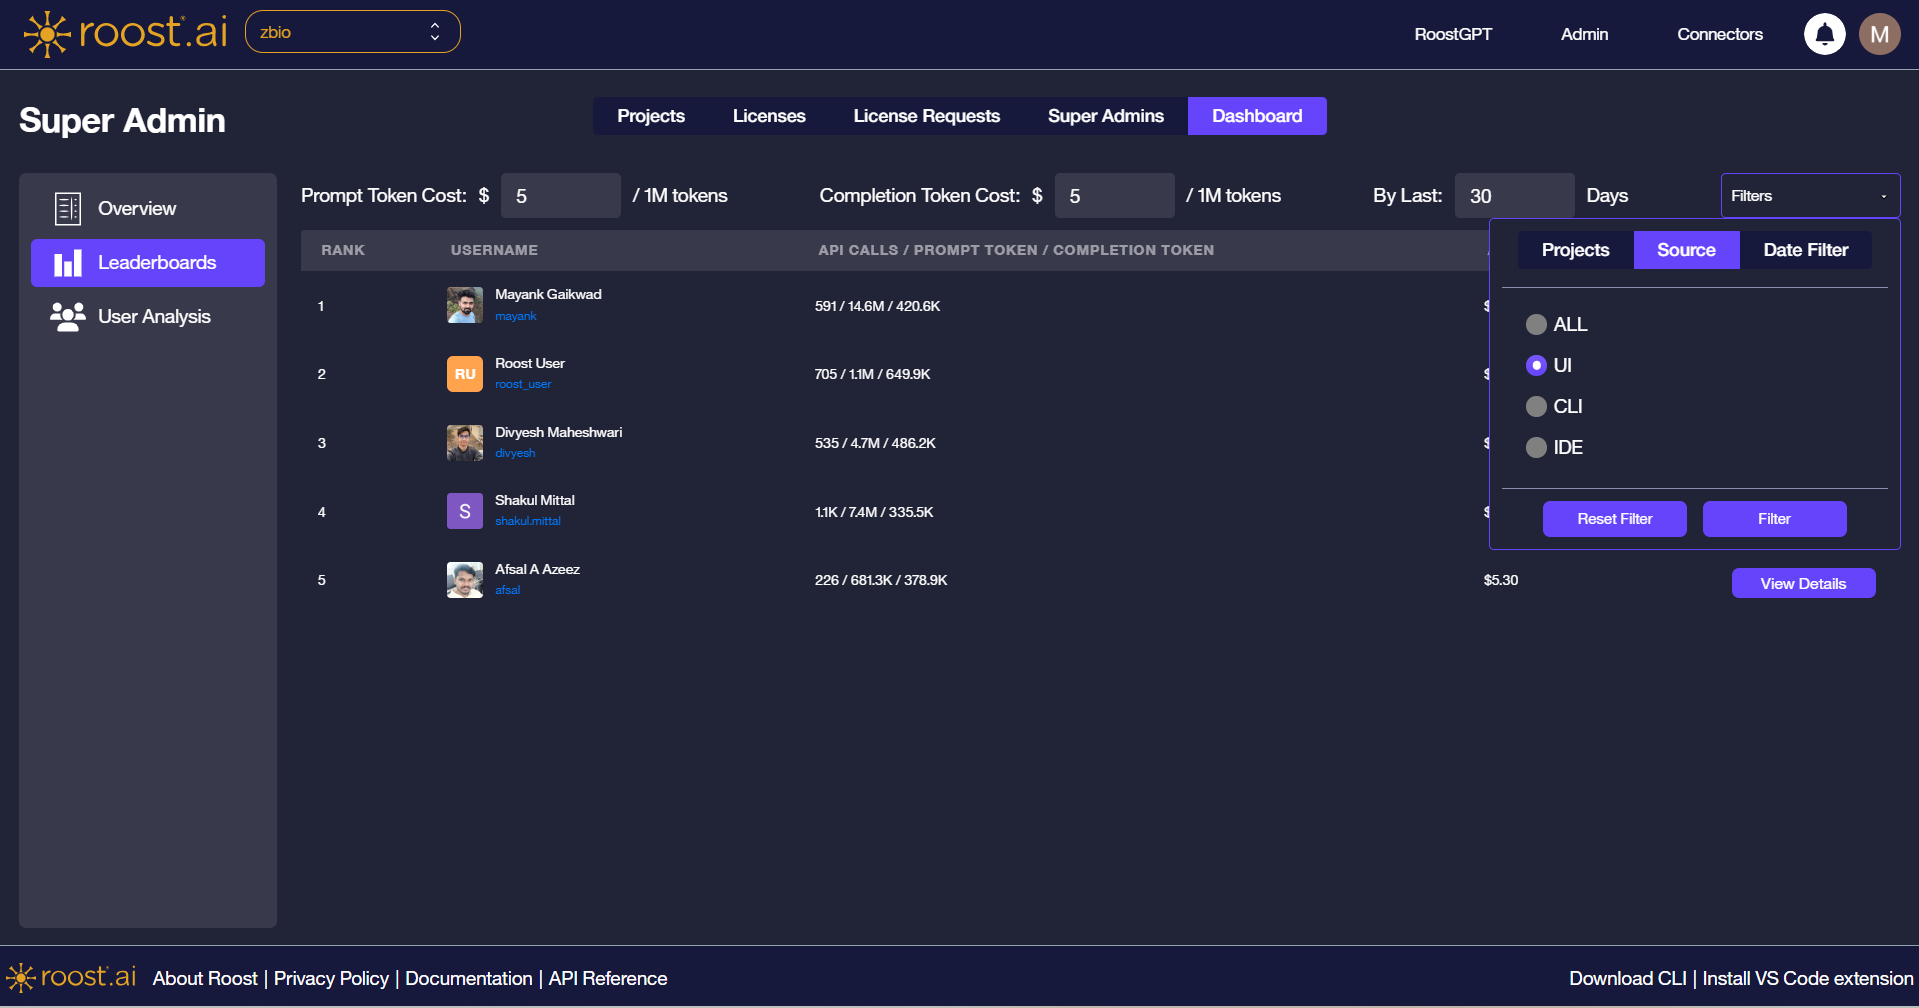
Source
Filter users by how they triggered test generation: All, UI, CLI, or IDE.
Date Filter
Switch between a custom date range and a rolling Last N Days window. The By Last field on the main header defaults to 30 days and reflects the active date filter.
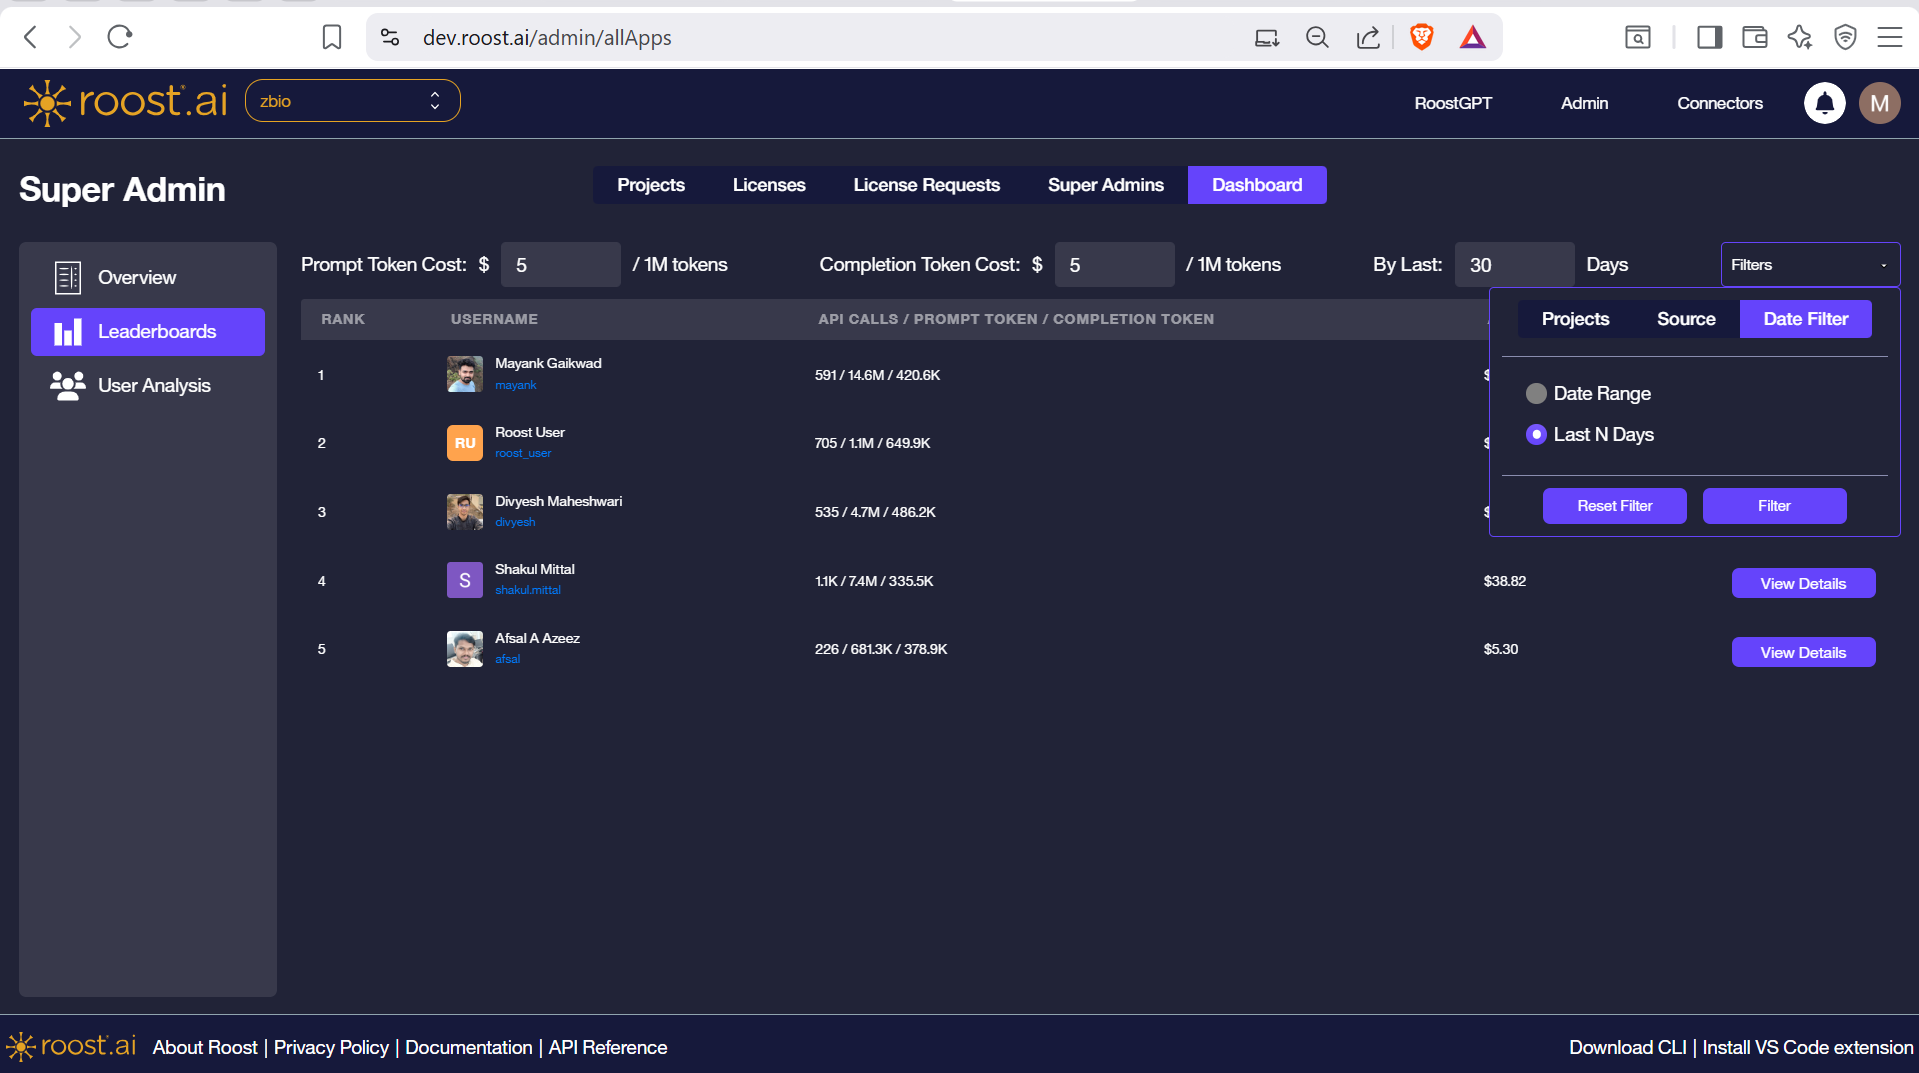
Filters take effect immediately when applied. Click Reset Filter to restore defaults.
Navigating to User Analysis
Click View Details in the Actions column to open the full activity breakdown for that user in the User Analysis view.